Trouble with TED
The Trouble with dishonest TED Talks
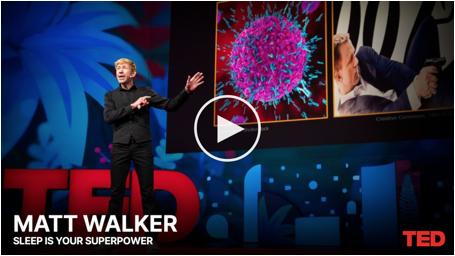
The opener to Matthew Walker’s TED Talk is not exactly what you’d expect to hear in a lecture about sleep.
“Men who sleep five hours a night have significantly smaller testicles than those who sleep seven hours or more,” Walker, a UC Berkeley professor of psychology and neuroscience, told the audience in 2019 at the popular media organization’s April 15-19 conference in Vancouver, Canada.
That got everyone’s attention. (Source: https://www.universityofcalifornia.edu/news/lack-sleep-shrinks-mens-testicles)
The video of Walker’s 19-minute “Sleep is your superpower” talk received more than 1 million views in the first 72 hours (as of publication, it’s up to more than 11,442,588 !) after it was posted on the TED Talks website.
I applaud both the outstanding delivery and the main message of his captivating presentation:
“In 1942, more than 90 percent of Americans were sleeping more than six hours a night. Today, almost 50 percent of Americans are surviving on a nightly six hours or less,” he told Berkeley News. “We need to reclaim our right to a full night of sleep, without embarrassment or the stigma of laziness.”
However, at about 8:45 into the talk, Matthew walks (no pun intended) on very thin ice:
“*I could tell you about sleep loss and your cardiovascular system, and that all it takes is one hour. Because there is a global experiment performed on 1.6 billion people across 70 countries twice a year, and it's called daylight saving time. Now, in the spring, when we lose one hour of sleep, we see a subsequent 24-percent increase in heart attacks that following day. In the autumn, when we gain an hour of sleep, we see a 21-percent reduction in heart attacks. Isn’t that incredible? And you see exactly the same profile for car crashes, road traffic accidents, even suicide rates.”
Now I tend to be sensitive to gross exaggerations disguised as “scientific findings” and upon hearing of such a ridiculously large effect of a one-day-one-hour sleep disturbance, all of my alarm bells went up!
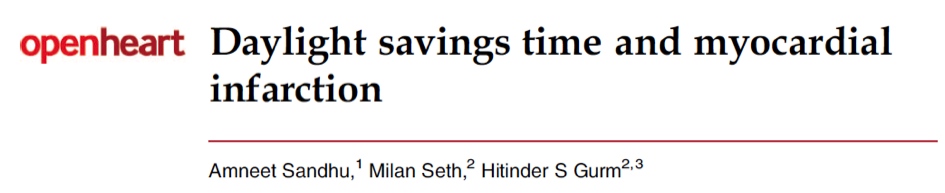
Initially I was super excited about the suggested sample size of 1.6 billion people and wanted to find out how exactly such an incredible data set could possibly have been gathered. Upon my inquiry, Matthew was kind enough to point me to the paper, which was the basis for the rather outrageous claims from above. Luckily, it is an open access article in the openheart Journal from 2014.
Imagine my grave disappointment to find out that the sample was limited to 3 years in the state of Michigan and had just 31 cases per day! On page 4 you find Table 1 which contains the quoted 24% increase and 21% decrease expressed as relative risk (multipliers 1.24 and 0.79, respectively):
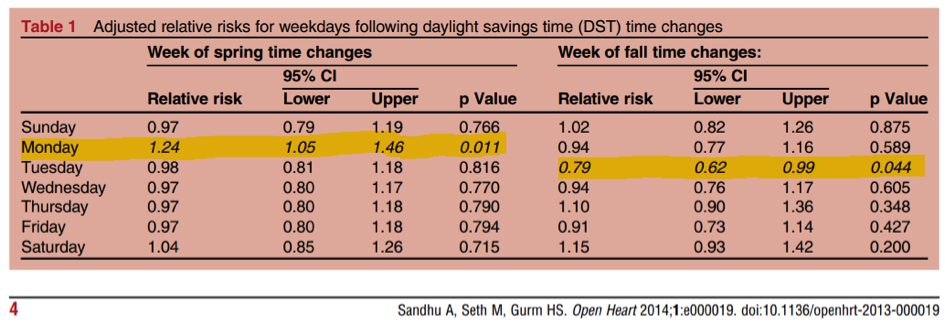
Not mentioned in the talk is that the low sample size leads to rather wide confidence intervals of [1.05; 1.46] in the spring and [0.62; 0.99] in the fall, which makes for a lot less dramatic possible effects of 5% upwards and 1% downwards.
More importantly, these changes were not observed on the “following day” after DST but instead on a Monday and Tuesday, respectively. Why did Matthew Walker choose these somewhat random days? My guess would be, because they were the only ones significant at the 5% level, which would be a classic case of “p-value fishing”. If one adjusted for the multiple comparisons (7 days of the week were tested), the significance disappears altogether. In that light it is no surprise that the authors “looked for the same signal in more recent data and it is markedly attenuated and no longer significant” (private communications with Dr. Gurm).
I would claim that our intuition does not expect a measurable/large effect of DST on one particular day. In a similar context, Gelman and Weakliem have pointed out the statistical challenges in estimating small effects: “… systematic errors such as overestimation of the magnitudes of small effects can mislead scientists and, through them, the general public”.
The brash and reckless overstatement of these modest/insignificant heart attack numbers really worries me, since they do not come from a tabloid journalist, YouTuber or casual blogger but from a renowned scientist at the esteemed University of Berkeley. BTW, I was unable to find any backing of the statement on “exactly the same profile for car crashes, road traffic accidents, even suicide rates” in the literature.
What about the click-bait-type opening line of those “significantly smaller testicles of men who sleep only five hours”? Unfortunately, Prof. Walker did not reveal the corresponding academic sources. The most likely and relevant paper I found on Google Scholar is a study of the association between sleep disturbances and semen quality from 2012:
This demographically extremely narrow study focusses mainly on semen quality but also reports that. “After control for confounders, sperm concentration, total sperm count, percent motile spermatozoa, percent morphologically normal spermatozoa, and testis size were significantly lower among both men with higher sleep scores and men with lower sleep scores in comparison with the reference group”. Table 3 contains the main results, with testis size highlighted:
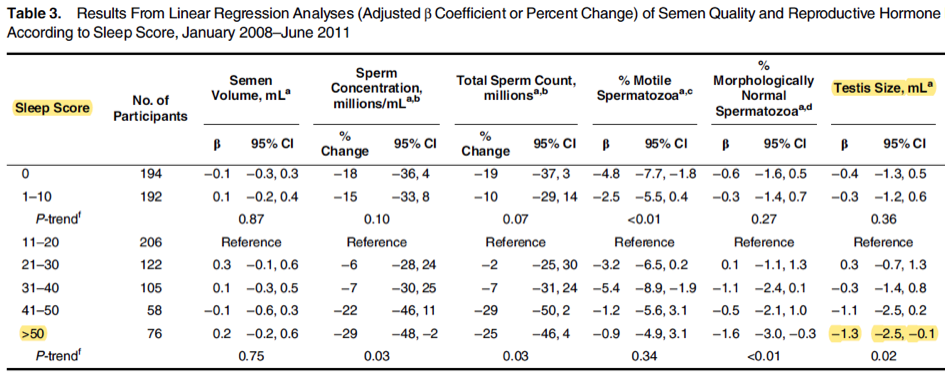
Notice the low sample size in the „>50” category (76 men) and the wide confidence interval for \(\beta\) ([-2.5; -0.1]) which almost includes zero1.
To give the reader a feel for the magnitude of the effect: The upper end
of the CI should be compared with the median/mean of about 21ml, so
“significant” really means a reduction of about 0.5 %! It is further noteworthy that an even more
significant reduction of testis size was observed for the extremely good
sleep score of zero2.
The authors of this paper did not see how the sleep score >50 could
possibly be translated into “Men who sleep five hours a night”.
Maybe the answer can be found in this article on sleep duration and
tesis size in the Journal
of Clinical Sleep Medicine? The main result seems to be a barely
significant observational association based on either 66 or 97
participants, which disappears under resampling. The sample size is too
low to control for other factors (e.g. race/ethnicity, lifestyle,
smoking, alcohol consumption ) than BMI and age and no causality can be
inferred. Furthermore, it is not clear how exactly the sleep duration
was computed from the various scores derived via (i) self-reported
duration, (ii) one-night sleep laboratory, and (iii) a 7-day wrist
actigraphy recording. The many possibilities of creating these scores
leaves the reader somewhat uneasy about reliability of the p-value.
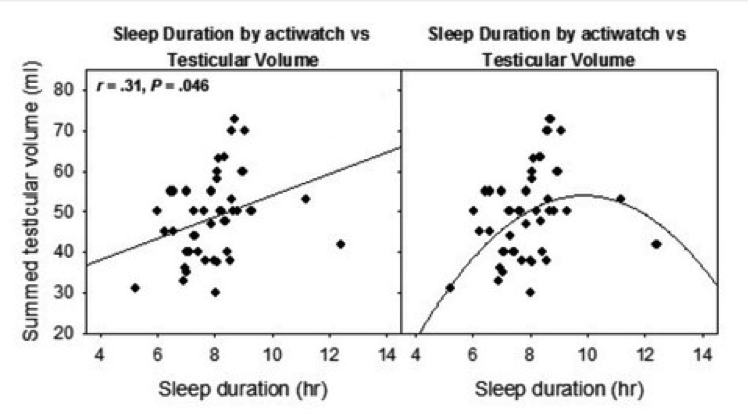
A scatter plot (Fig.2 in the paper) of testicular volume versus sleep
duration shows the ambivalence of model fitting (and suggests that the
sample size was even lower than reported).
What is my takeaway from this rather sobering fact finding mission after listening to the -at first glance- truly inspiring TED talk?
-
Sleep disturbances were assessed on the basis of a modified 4-item version of the Karolinska Sleep Questionnaire which includes questions on sleep patterns during the past 4 weeks: How often have you 1) “slept badly or restlessly”; 2) “found it difficult to fall asleep”; 3) “woken up too early in the morning and not been able to go back to sleep”; and 4) “woken up several times during the night and found it difficult to go back to sleep”? ↩
-
Sleep score was calculated as the mean of the participant’s replies to the 4 sleep questions:
“all the time” (scoring 100%), “a large part of the time” (scoring 67%), “rarely” (scoring 33%), or “never” (scoring
0%) and was categorized as 0, 1–10, 11–20 (reference), 21–30, 31–40, 41–50, or >50. The category 11–20 was used as the reference category because this group of men had the highest sperm count. ↩