Corona Vaccine
Corona Vaccine “at least 90 % effective” ?
Pfizer and Biontech announced a breakthrough in the race toward a vaccination against the Corona virus:
“The case split between vaccinated individuals and those who received the placebo indicates a vaccine efficacy rate above 90%, at 7 days after the second dose. This means that protection is achieved 28 days after the initiation of the vaccination, which consists of a 2-dose schedule.”
The efficacy is defined as one minus the relative risk ratio:
\[efficacy =1- \frac{risk_{vaccinated}}{risk_{unvaccinated}}\]Despite a lengthy search, I was unable to find more information than the following numbers:
Study enrolled 43,538 participants, 94 confirmed cases of COVID-19 in trial participants.
I wished I could find data on the 2x2 table. “At least 90%” efficacy suggests to me that this is a lower bound on a confidence interval. For rare diseases, the relative risk is approximately equal to the odds ratio. Starting from a contingency table
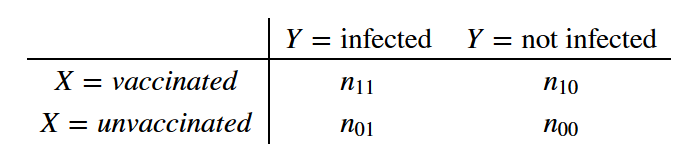
a confidence interval for the log odds is approximately equal to
\[\log(OR) - 1.96 \sqrt{\dfrac{1}{n_{11}} + \dfrac{1}{n_{10}} + \dfrac{1}{n_{01}} + \dfrac{1}{n_{00}}}\]So for an even split of placebo/vaccination among the 43,538 enrolled, the upper bound of the CI (for the odds ratio) for e.g. 3 of 94 infected people having been vaccinated is (yes, we could omit the last two fractions):
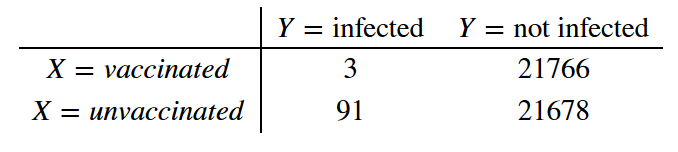
\[\exp{\left(\log(3/91) + 1.96 \sqrt{\dfrac{1}{3} + \dfrac{1}{91} + \dfrac{1}{21678} + \dfrac{1}{21766}} \right)} \approx 0.1\]which would lead to a lower bound of the vaccine efficiency of 90% (=1-0.1). So I am concluding that the 2x2 table looked like this
import numpy as np
import matplotlib.pyplot as plt

CIupper = np.exp(np.log(3/91) + 1.96*np.sqrt(1/3 + 1/91 + 1/21678 + 1/21766))
np.round(CIupper,2)
0.1
Bootstrap based CI
Instead of relying on the approximation of a parametric confidence interval, we can draw “many” bootstrapped samples of the data and estimate the CI of the relative risk directly.
def bootstrap_replicate_1d(data, func):
    return func(np.random.choice(data, size=len(data)))

def draw_bs_reps(data, func, size=1):
    """Draw bootstrap replicates."""

    # Initialize array of replicates: bs_replicates
    bs_replicates = np.empty(size)

    # Generate replicates
    for i in range(size):
        bs_replicates[i] = bootstrap_replicate_1d(data, func)

    return bs_replicates
M=1000

# Construct arrays of data:
Vaccinated = np.array([True] * 3 + [False] * (21769 - 3))
NotVaccinated = np.array([True] * 91 + [False] * (21769 - 91))

# Compute 1,000 bootstrap replicates from shifted arrays
bs_replicates_V = draw_bs_reps(Vaccinated, np.sum, size=M)
bs_replicates_NV = draw_bs_reps(NotVaccinated, np.sum, size=M)

#relative risks:
RR =bs_replicates_V/bs_replicates_NV
tmp=plt.hist(1-RR,density=True, facecolor='g')
plt.xlabel('vaccine efficacy')
plt.ylabel('Probability')
plt.title('Bootstrapped Distribution of efficacy')
plt.grid(True)
plt.show()
#LowerBoundEfficiency
np.round(np.quantile(1-RR,0.025),3)
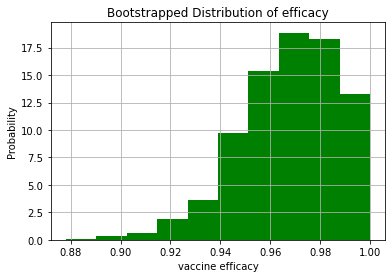
0.924
So, the nonparametric confidence interval is more optimistic and yields a lower bound of 92.4 % vaccine efficiency.
Update, Nov 18th
Incredible milestone for science. Pfizer and BioNTech update their promising COVID-19 vaccine result
In all, the trial had 162 confirmed cases of symptomatic COVID-19 in the placebo group versus eight among those who received the two scheduled doses of the vaccine. The efficacy, which was measured 7 days after the second dose of the vaccine, was the same in different races and ethnicities, the companies say—although subgroup analyses always have more uncertainty.
Inf = [8,162]

CIupper = np.exp(np.log(Inf[0]/Inf[1]) + 1.96*np.sqrt(1/Inf[0] + 1/Inf[1] + 1/(21769-Inf[0]) + 1/(21769-Inf[1])))
1-np.round(CIupper,3)
0.9
M=1000
# Construct arrays of data:
Vaccinated = np.array([True] * Inf[0] + [False] * (21769 - Inf[0]))
NotVaccinated = np.array([True] * Inf[1] + [False] * (21769 - Inf[1]))

# Compute 1,000 bootstrap replicates from shifted arrays
bs_replicates_V = draw_bs_reps(Vaccinated, np.sum, size=M)
bs_replicates_NV = draw_bs_reps(NotVaccinated, np.sum, size=M)

#relative risks:
RR =bs_replicates_V/bs_replicates_NV
tmp=plt.hist(1-RR,density=True, facecolor='g')
plt.xlabel('vaccine efficacy')
plt.ylabel('Probability')
plt.title('Bootstrapped Distribution of efficacy')
plt.grid(True)
plt.show()
#LowerBoundEfficiency
np.round(np.quantile(1-RR,0.025),3)
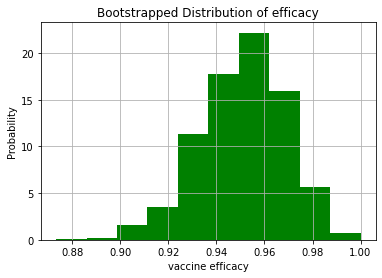
0.912
One-sided CI
To be fair, we should probably compute a one-sided confidence interval since we really have “no problem” with uncertainties upward.
#one-tail confidence interval:
np.round(np.quantile(1-RR,0.05),3)
0.92